{mapdeck}を試してみる(2/5) Polygon編
前回の続き。
まずは国土数値情報 交通流動量 パーソントリップ発生・集中量データでPolygonの描画を試してみる。
データの準備
データの取得は@yutannihilation氏の{kokudosuuchi}を使用させて頂いた。*1
> # 国土数値情報 交通流動量 パーソントリップ発生・集中量データの取得
> library(dplyr)
> library(kokudosuuchi)
> dat.oc <- getKSJURL("S05-a") %>%
+   # 東京都市圏に限定
+   filter(areaCode == "100") %>%
+   select(zipFileUrl) %>%
+   as.character() %>%
+   getKSJData()
Using the cached zip file: /var/folders/xl/wm11q0z951nf03drkv4dsltw0000gn/T//Rtmpa9PJJI/S05-a-10_SYUTO_GML.zip

Details about this data can be found at http://nlftp.mlit.go.jp/ksj/gml/datalist/KsjTmplt-S05-a-v2_2.html
>
> glimpse(dat.oc)
List of 1
 $ S05-a-10_SYUTO-g_Occurred_ConcentratedTrafficVolumeOfPersonTrip:Classes ‘sf’, ‘tbl_df’, ‘tbl’ and 'data.frame':   1202 obs. of  36 variables:
  ..$ S05a_001: chr [1:1202] "1" "1" "1" "1" ...
  ..$ S05a_002: chr [1:1202] "2008" "2008" "2008" "2008" ...
  ..$ S05a_003: chr [1:1202] "1" "1" "1" "1" ...
(以下略)
発生・集中のデータをlong-formatで保持しているのでtidyr::spread()でwide-formatに変換し、流入(集中 - 発生)の項目を追加する。
> library(sf)
> library(tidyr)
> sf.oc <- dat.oc[[1]] %>%
+   # 発生集中をコードからラベルに変換, 全トリップ数を文字列から数値に変換
+   mutate(S05a_003 = ifelse(S05a_003 == "1", "Occurrence", "Concentrated"),
+          S05a_035 = as.numeric(S05a_035)) %>%
+   rename(zonecode = S05a_004,
+          oc = S05a_003,
+          all_trip = S05a_035) %>%
+   select(zonecode, oc, all_trip, geometry) %>%
+   # long-formatからwide-formatに変換
+   spread(key = oc, value = all_trip) %>%
+   # 流入量を計算
+   mutate(inflow = Concentrated - Occurrence) %>%
+   # ゾーンコード、流入量
+   select(zonecode, inflow, geometry) %>%
+   st_set_crs(4612) %>%
+   st_transform(4326)
>
> glimpse(sf.oc)
Observations: 601
Variables: 3
$ zonecode <chr> "0010", "0011", "0012", "0013", "0020", "0021", "0022", "0023", "0024", "0030", "0031", "0032", "0033", "0034", "0110"...
$ inflow   <dbl> 1735, 1443, 1727, 1757, 2158, 1249, 1174, -976, -7, 752, 2530, -435, 994, -477, -567, -676, -1438, 40, 84, -189, -96,...
$ geometry <MULTIPOLYGON [°]> MULTIPOLYGON (((139.7526 35..., MULTIPOLYGON (((139.7508 35..., MULTIPOLYGON (((139.7731 35..., MULTIPOL...
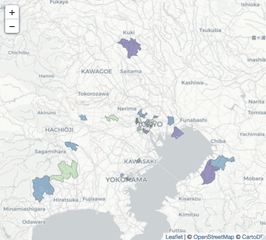
{leaflet}で確認してみる。
> # 流入量上位30件を描画
> sf.oc.sub <- sf.oc %>%
+   arrange(desc(inflow)) %>%
+   head(n = 30) %>%
+   arrange(inflow) %>%
+   # mapdeck::add_polygon()はMULTIPOLYGONに対応していないためPOLYGONに変換
+   st_cast("POLYGON")
 警告メッセージ:
 st_cast.sf(., "POLYGON") で:
  repeating attributes for all sub-geometries for which they may not be constant
>
> library(leaflet)
> pal = colorNumeric(domain = sf.oc.sub$inflow, palette = "Spectral", reverse = TRUE)
>
> sf.oc.sub %>%
+   leaflet() %>%
+   addProviderTiles(providers$CartoDB.Positron) %>%
+   addPolygons(fillColor = ~pal(inflow), fillOpacity = 0.5, color = "gray", weight = 1)

小さくて分かりづらいが流入トップは新宿。単純に全トリップの流入だけだと郊外も多いのが意外。(出勤・登校トリップと帰宅トリップで相殺されるから当然なのかも)
Polygonの描画
{mapdeck}でPolygonの描画はadd_polygon()で行う。引数は以下の通り。
| 引数 | 説明 |
|---|---|
| map | mapdeck地図オブジェクト |
| data | レイヤで使用するデータ |
| polyline | ポリゴンの列 |
| stroke_colour | 線の色の列名 or 16進数 |
| stroke_width | 線の太さ |
| fill_colour | 塗り潰す色の列名 or 16進数 |
| fill_opacity | 透明度 |
| elevation | ポリゴンの高さ |
| tooltip | ツールチップに表示するテキスト or HTMLの列名 |
| auto_highlight | マウスオーバー時にオートハイライトするか |
| light_settings | ライトの設定 |
| layer_id | レイヤID(同じタイプのレイヤを区別するために使用される) |
| digits | 緯度・経度の小数点以下の桁数 |
| palette | 色を生成する関数 |
上で準備したデータをmapdeck:: add_polygon()で描画すると以下のようになる。
> library(googlePolylines)
> library(mapdeck)
> library(RColorBrewer)
> mapdeck(style = mapdeck_style("light"), zoom = 8, location = c(139.745433, 35.658581)) %>%
+   add_polygon(
+     data = sf.oc.sub,
+     polyline = "geometry",
+     layer_id = "polygon_layer",
+     fill_colour = "inflow",
+     fill_opacity = 128,
+     tooltip = "inflow",
+     palette = colorRampPalette(rev(brewer.pal(11, "Spectral")))
+   )

引数のelevationで高さを指定すると以下のようになる。
> mapdeck(style = mapdeck_style("light"), zoom = 11, location = c(139.745433, 35.658581), pitch = 45) %>%
+   add_polygon(
+     data = sf.oc.sub,
+     polyline = "geometry",
+     layer_id = "polygon_layer",
+     fill_colour = "inflow",
+     elevation = "inflow",
+     tooltip = "inflow",
+     palette = colorRampPalette(rev(brewer.pal(11, "Spectral")))
+   )

次回はadd_path()を試す。